Page Content
Receiving Email Notifications
Notifications allow you to subscribe to scan results by email. You can choose to send the information in various formats including Link, PDF, or Table Only. Subscriptions can be delivered after any scans defined within the View is run, or at regularly scheduled intervals.
Views
View
A View is a presentation of data from the results database. A View may contain a graphical chart, a textual summary, and/or table of Checkpoint results.
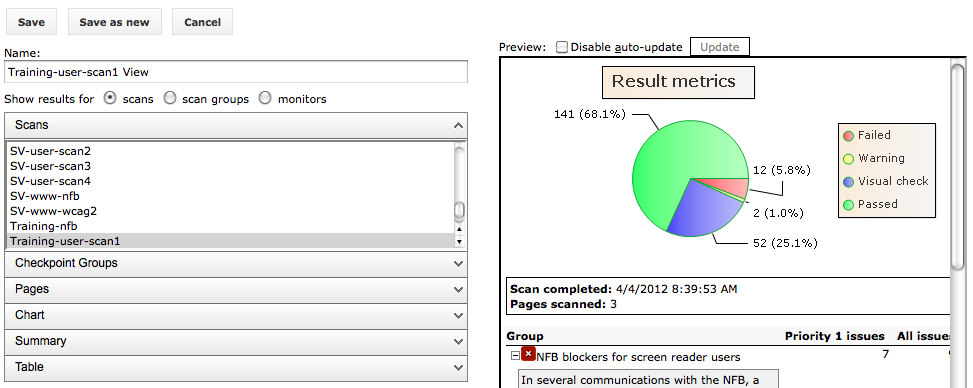
Creating New Views
Creating additional views can assist you in displaying only the statistics which are most important to your unit such as custom chart types, rendered statistics, or modified table displays. From the Views tab, click New, and then add Scans or Scan Groups to be displayed. If you would like to generate a report similar to Full Details, choose the default options.
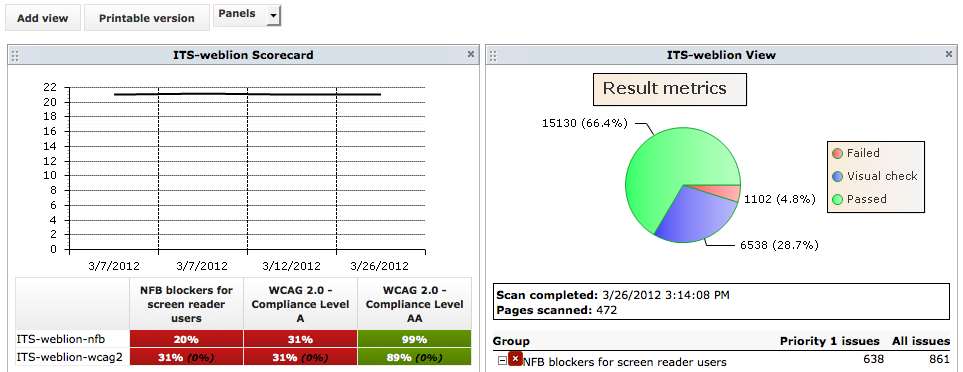
Scorecards
Scorecards are a modified visualization of Views. A Scorecard is a table that gives you a visual sense of how well your organization is meeting its unique web compliance standards. By allowing you to make side-by-side comparisons of several sites or groups of sites across your network, a Scorecard allows you to see which areas of your site network are exceeding your goals, which areas need further attention, and which areas have improved or declined.
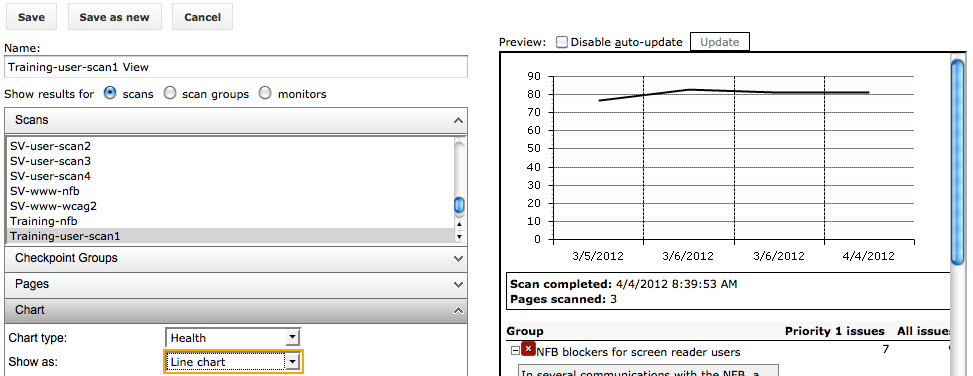
Creating New Scorecards
Creating additional scorecards can assist you in comparing only the scan results which are most important to you. From the Views tab, click New, and then add Scans or Scan Groups to be displayed. The two options which are the most important for historical comparison are the Health Line Chart types and the Scorecard Tables types.
Dashboard
Dashboards enable a one-stop location to list and compare Views. Dashboards are directly driven by custom Views, and cannot be created without first creating a View. Dashboards are specific to the user only and cannot be enabled group-wide.