

Page Content
To access reports, click Scans, then the Health Score percentage for your scan.
Health Percentage
This number is generated based on a custom algorithm, but does not provide the most detailed information. The other reports listed below provide more information.

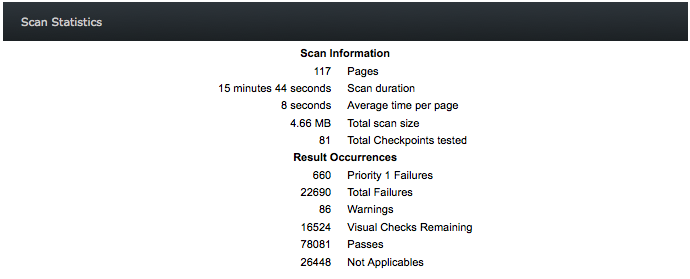
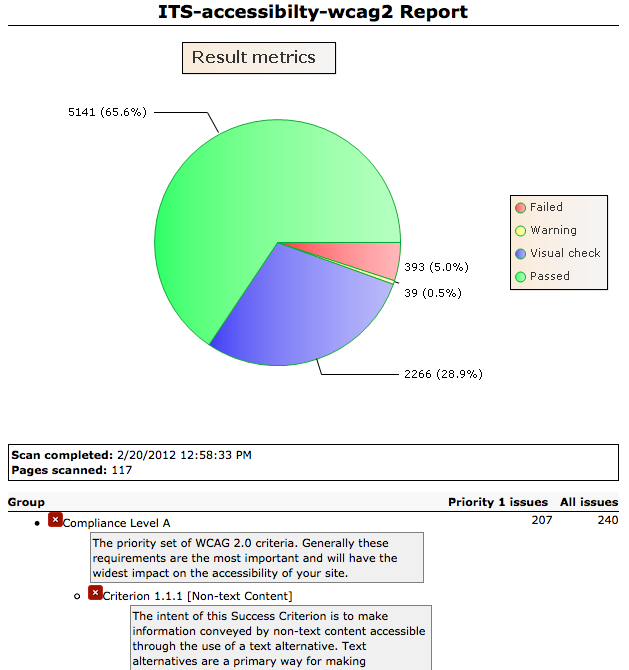
Scan Statistics
A comprehensive listing of the statistical results from a scan. This is useful for obtaining a total number of passes, warnings, and failures.
117                             Pages
15 minutes 44 seconds     	Scan duration
8 seconds             	        Average time per page
4.66 MB     	                Total scan size
81     	                        Total Checkpoints tested
Result Occurrences
660     	                Priority 1 Failures
22690     	                Total Failures
86                              Warnings
16524     	                Visual Checks Remaining
78081     	                Passes
26488     	                Not Applicables
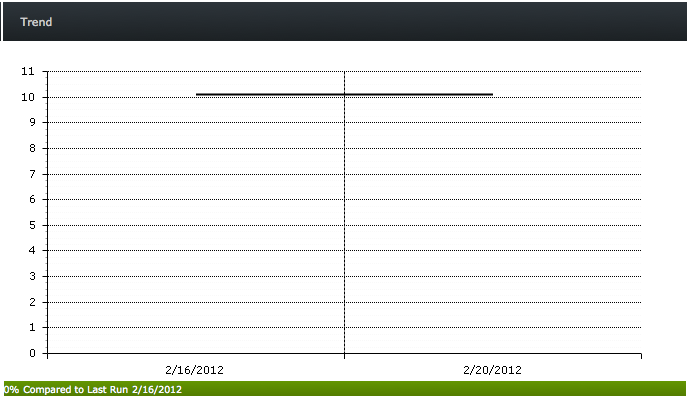
Trend
Trends are represented by a line graph showing changes to your website’s health percentage overtime.
Top 10 Checkpoints
This list includes the checkpoint failures that occur most frequently across your site. This is a good place to start when you're looking for the top compliance issues your site faces.
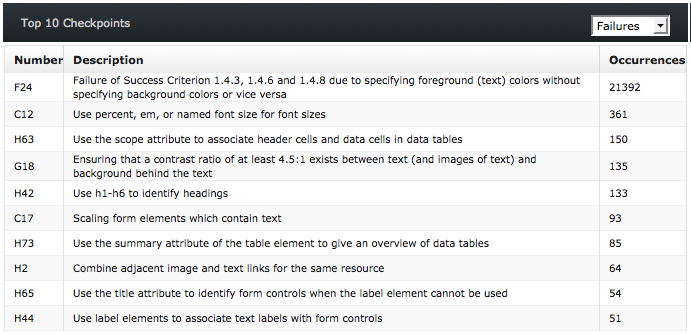
There are several click-able links within this table:
- Number combinations will take you to the checkpoint itself.
- Description or Occurrences will take you to an overview the checkpoint-related issues found within the code.
Top 10 Issues
This list includes the checkpoint failures that occur on the most pages within your site. This is a good place to start if you're looking for the top compliance issues that are affecting your overall Health Percentage.
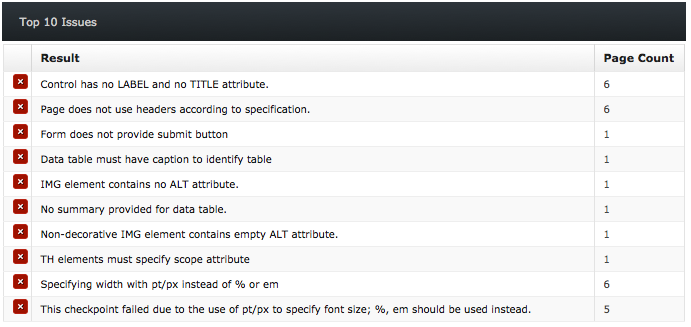
Clicking the description will take you to a cached rendered view of your site with the problematic area highlighted. By navigating the links in the large horizontal bar at the top of the page, you can:
- Previous/Next: Navigate to the next occurance
- How to fix?: Read a full explanation of the WCAG 2.0 rule
- Code source: Find the specific line in the code causing the failure
Top 10 Recent Checkpoints Changed via Results Revision
In general, you should not notice any changes listed in this column unless you are revising your results to exclude specific compliance issues.
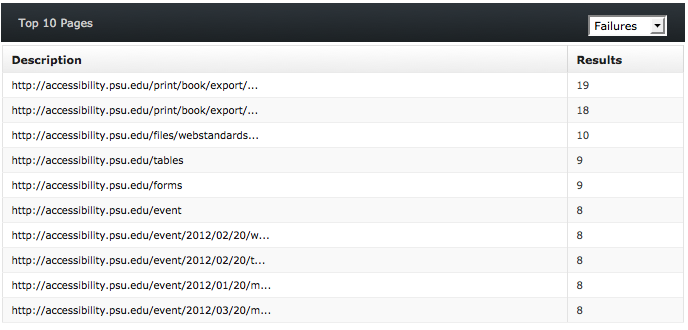
Top 10 Pages
This is a list of the top 10 pages on your site which contain the most failures.
Full Details
To see a detailed list of all the failures and warnings in a printable Report: Click Health Percentage, View Full Details
- To see a rendered view with the problematic area of the page highlighted, click the page where the error originates.
- To see the problematic source code, click the code where the error originates.