

Page Content
Charts, graphs and maps use visuals to convey complex images to users. But since they are images, these media provide serious accessibility issues to colorblind users and users of screen readers. See the examples on this page for details on how to make charts more accessible.
Synopsis
- If the data in a chart, graph or map is crucial to the content of a Web page, then you must provide a text description of the image. In some cases, a numeric table replicating the chart data could provide additional accessibility.
WCAG 2.0 Guideline 1.1.1—"All non-text content that is presented to the user has a text alternative that serves the equivalent purpose…"
- Supplement color-coding of charts with texture, differences in line style, text in graphs or different shades of color to improve accessibility for colorblind users. Charts should be readable in black and white.
NOTE: The default settings of the Chart Wizard in Excel are not color accessible. Use the formatting tools to change line styles and colors.WCAG 2.0 Guideline 1.4.1—"Color is not used as the only visual means of conveying information, indicating an action, prompting a response, or distinguishing a visual element."
- Don’t convert tables of data into images—use an actual data table instead.
Text Descriptions for Charts
Strategies
Generally speaking an ALT tag cannot do justice to a complex chart. One way to describe a chart is to provide both a text summary and a properly coded data table near the chart.
This serves multiple audiences because a chart can show trends, but a table can provide exact data for those who are interested.
Example: Languages in U.S. versus Pennsylvania
The following bar chart shows the percentage of English versus Spanish versus other languages in the U.S. versus Pennsylvania, Philadelphia and Pittsburgh.
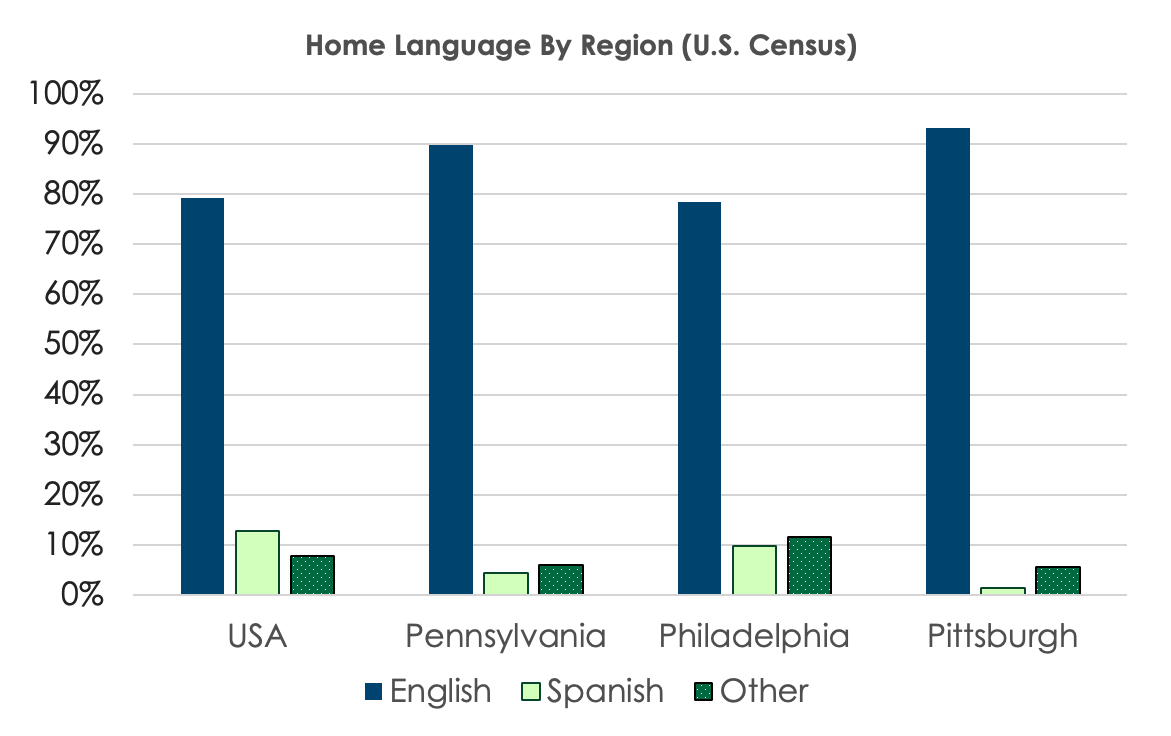
ALT= Bar Chart ‘Home Language By Region’ showing percentage of English, Spanish and Other Languages for the U.S., Pennsylvania, Philadelphia and Pittsburgh. See specific data in the summary and table below.
Data from: U.S. Census.
Sample Text Description for Language Chart
Below is a description of the trends.
Summary of Trends
The chart above shows that the percentage of monolingual English speakers is slightly higher in Pennsylvania than the rest of the U.S. – with the exception of Philadelphia.
Note that in Pittsburgh, the percentage of Spanish speakers is much lower than elsewhere in the state or country.
Repeat Data in Chart
This is the chart showing the specific numeric data. Please note that the data table features captions and header rows.
| Language | U.S.A. | Pennsylvania | Philadelpha | Pittsburgh |
|---|---|---|---|---|
| English | 79.29% | 89.68% | 78.45% | 93.07% |
| Spanish | 12.85% | 4.37% | 9.90% | 1.38% |
| Other | 7.86% | 5.95% | 11.65% | 5.56% |
Charts With Color
Sample Data
These charts will document the number of computers by platform.
| Platform | Number of Students |
|---|---|
| Windows | 16 |
| Linux | 3 |
| Macintosh | 1 |
Bar Charts
Below are some examples of charts with inaccessible and accessible color choices
and formats.
Inaccessible Bar Chart
Below is an image of an inaccessible bar chart for distribution of platforms in 2003. Solid sections of red and green are used, both of similar brightness, and therefore may not be distinguishable for colorblind users.
In addition, the only key to the chart refers to the colors, thus information is only conveyed by color.

In Grayscale
Accessible Version of Bar Chart
The bar chart have been changed to shades of blue (with paler bars set with a dark border). Colorblind users can use the different levels of darkness to tell the platforms apart. In addition, labels for each platform have been added to the bottom of the chart, so that viewers do not even have to refer to the key.
Line Charts
For line charts, changing the style of the graph lines and adding labels increases usability.
Inaccessible Line Chart
This is an inaccessible line chart based on the data in the table
comparing percentage of Mac and Windows users in 1990 and 2003.
As with the previous inaccessible chart, this chart uses three colors of lines, all of similar brightness, with a key that only refers to color. In grayscale, these colors are virtually identical.
Accessible Version of Line Chart
This chart replaces three solid lines with one solid line and two dotted lines, with labels for each.

Last Update: March 26, 2024